
Earth Change Monitors
Polar Earthquake Monitor
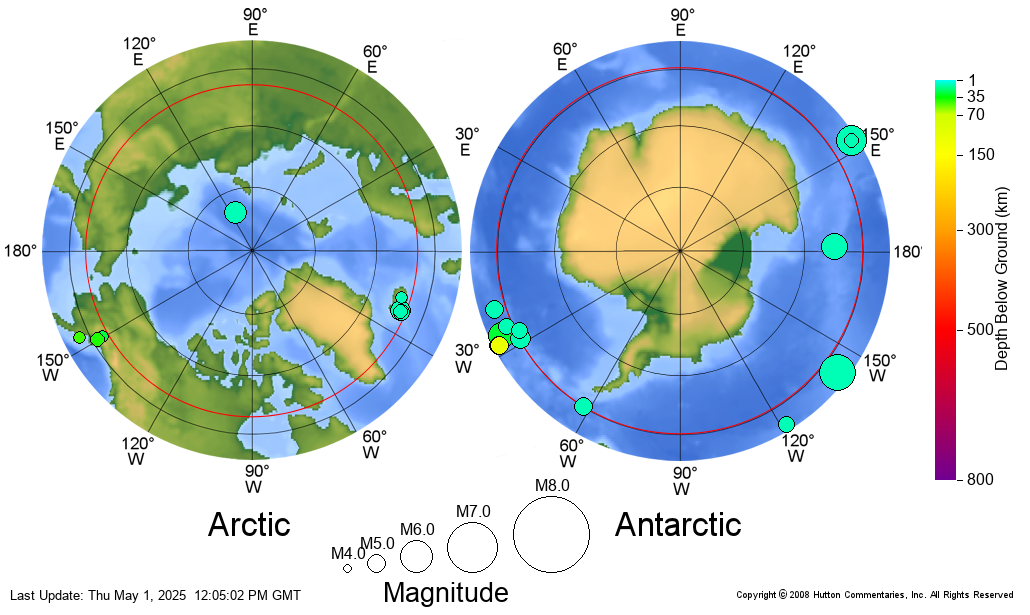
This graphic shows the locations, magnitudes, and depths of all earthquakes of M4.0 or greater occurring within (or near to) the boundaries of the arctic and antarctic regions during the last 30 days. The red circles on the two maps define The Hutton Commentaries’ boundaries for the arctic (+63°N Lat.) and the antarctic (-60°S Lat.) regions. The graphic is updated daily.
Below the graphic of the two polar maps is a table of all the polar-region earthquakes that have occurred in the past 30 days, and which are plotted on the polar map graphic. Any earthquake greater than M6.4 will be highlighted in red in the table.
Polar Quakes For The Last 30 Days
Arctic Quakes
3 earthquakes reported
|
Antarctic Quakes
17 earthquakes reported
|
||||||||
| Date and Time | Latitude | Longitude | Magnitude | Depth* | Date and Time | Latitude | Longitude | Magnitude | Depth* |
| 2026-05-31 00:54:00 | 62.1963 | -26.4033 | 4.9 | 10 | 2026-05-25 16:12:57 | -57.9499 | -25.7657 | 4.9 | 131.676 |
| 2026-06-03 19:19:18 | 83.8038 | -2.5209 | 4.8 | 10 | 2026-05-26 16:22:50 | -58.6442 | -152.513 | 5.1 | 10 |
| 2026-06-13 20:14:14 | 64.5712 | -17.6115 | 4.8 | 10 | 2026-05-27 21:37:38 | -58.1685 | -26.017 | 4.6 | 98.847 |
| 2026-05-28 15:07:48 | -56.4113 | -26.5457 | 4.8 | 79.985 | |||||
| 2026-05-30 00:38:14 | -59.1715 | -26.3858 | 5 | 95.738 | |||||
| 2026-06-01 00:08:41 | -57.8645 | 157.424 | 4.9 | 10 | |||||
| 2026-06-01 10:32:50 | -57.8585 | 157.764 | 4.9 | 10 | |||||
| 2026-06-05 20:58:09 | -61.8467 | 161.168 | 5.6 | 10 | |||||
| 2026-06-08 14:20:10 | -55.7537 | -4.3787 | 5.5 | 10 | |||||
| 2026-06-08 19:11:21 | -55.7212 | -4.3752 | 5.4 | 10 | |||||
| 2026-06-15 22:38:35 | -55.383 | -26.5558 | 4.7 | 10 | |||||
| 2026-06-16 17:13:10 | -55.8718 | -26.336 | 4.8 | 21.841 | |||||
| 2026-06-17 19:48:25 | -55.73 | -26.0334 | 4.9 | 10 | |||||
| 2026-06-19 21:08:29 | -59.3446 | -26.5917 | 5.1 | 150.333 | |||||
| 2026-06-20 01:46:32 | -57.129 | 147.918 | 5.7 | 10 | |||||
| 2026-06-20 04:44:08 | -57.9998 | -25.4839 | 5.1 | 59.553 | |||||
| 2026-06-21 20:05:26 | -60.1068 | -62.4195 | 5 | 10 | |||||
* - kilometers